Solar + storage siting · AI-native
Siting distributed energy where it counts.
CapacitiMap analyzes millions of buildings, and the grid characteristics around them, to find the optimal location for your Distributed Energy Resource and Virtual Power Plant project.
- 4.5M
- buildings analyzed
- Minutes
- not months, to a list
- Public data
- transparent + sourced
Why it's different
No filters. No forms.
Just ask.
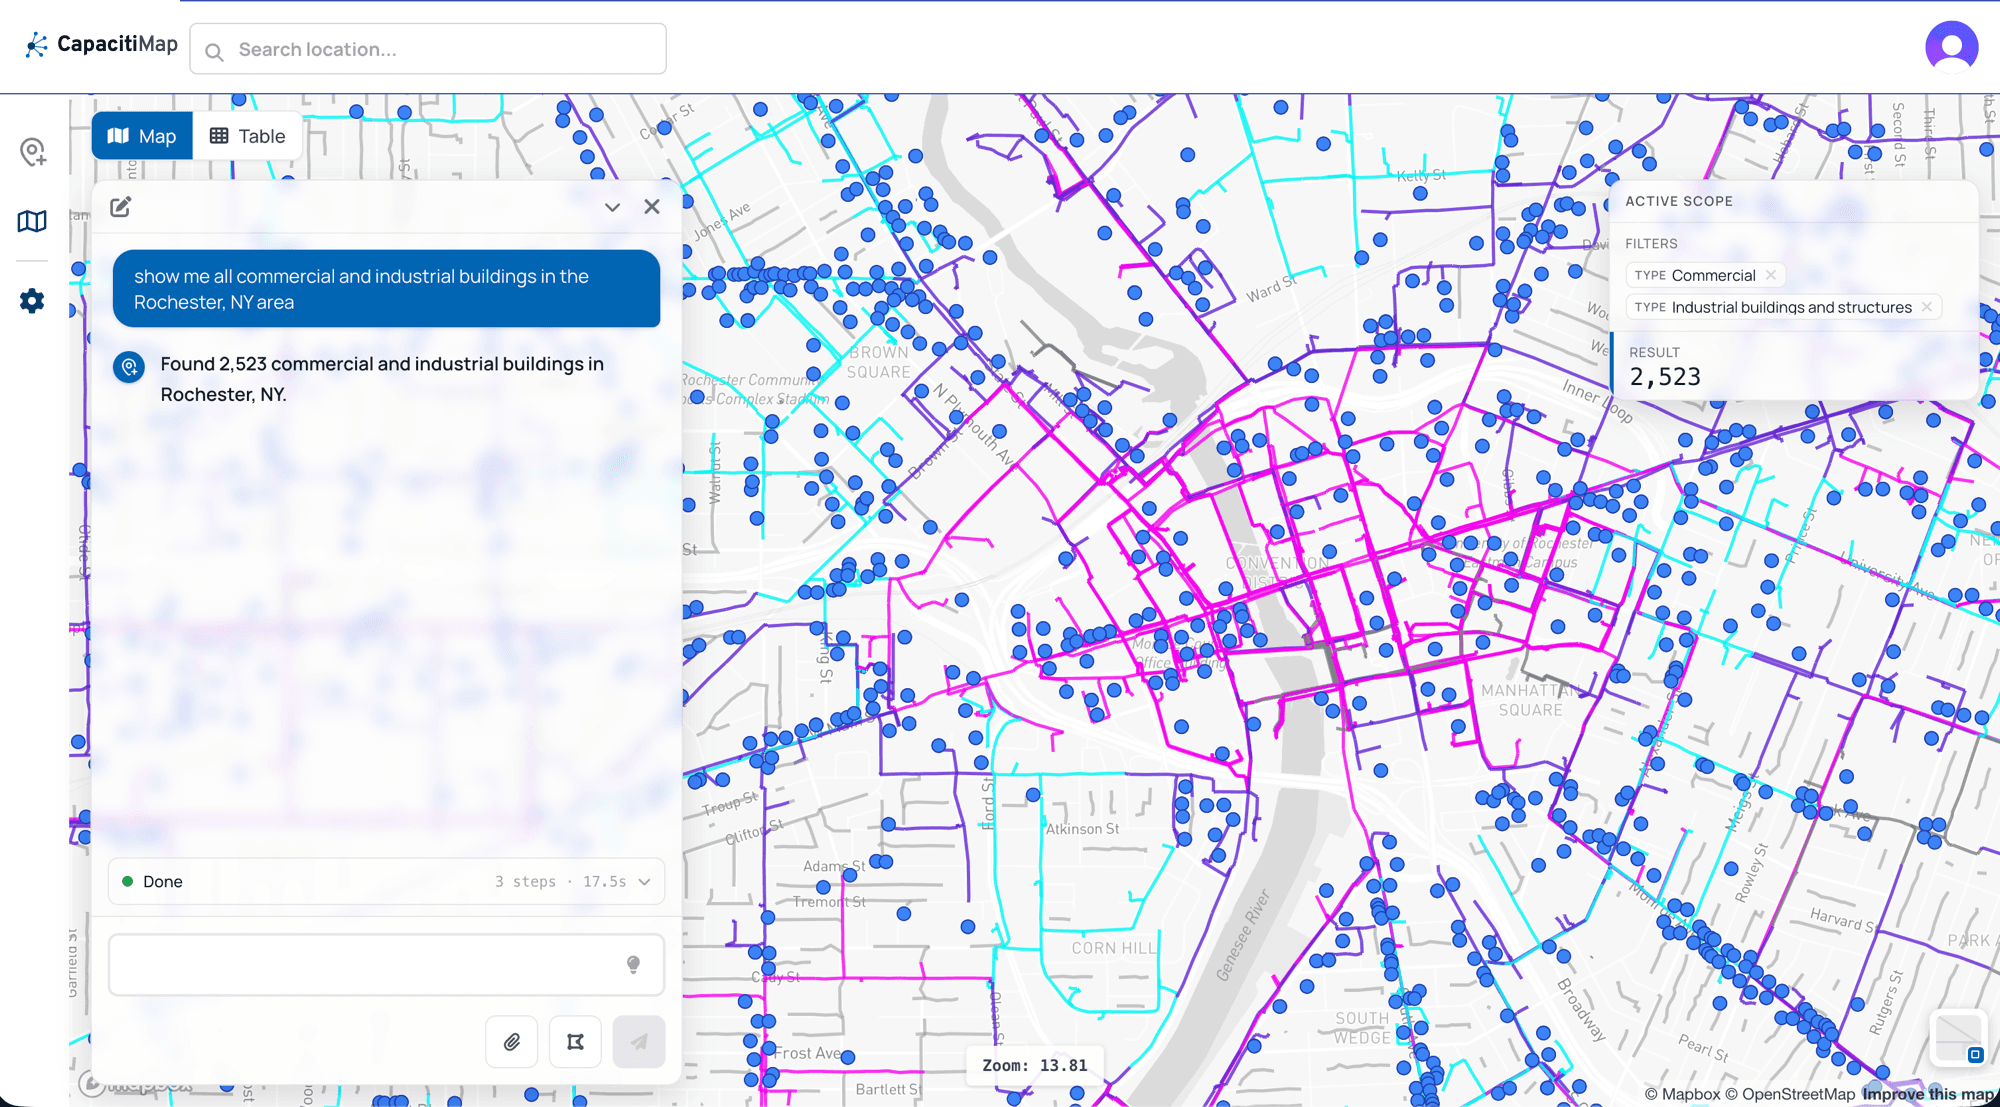
The old way meant learning a control panel — checkboxes, dropdowns, and sliders for every attribute. CapacitiMap replaces all of it with a conversation. Ask across buildings and the feeders that serve them — by type, by heating fuel, by grid capacity, by place — the way you'd ask a colleague who knows the whole territory.
What it does
From millions of buildings to the handful that matter.
Instant building intelligence
Parcel records, building attributes, and the feeder serving each one — joined for every building and ready to query.
Target the highest-value sites
Narrow a whole territory by the feeder serving each site — capacity, utilization, and load shape together, not a single headroom number.
Accelerate customer acquisition
Go from a whole service territory to a ranked list of prospects in minutes, not months.
Built on trusted public data
Transparent and fully sourced — analysis you can stand behind with customers and regulators.
Built for
Everyone siting the clean-energy transition.
Developers & aggregators
Find the sites where your solar, storage, and VPP projects will actually pencil out.
Utilities
See where DERs strengthen the grid — capacity, resilience, and reliability, together.
Community Choice Aggregators
Target programs where clean energy and community benefit align.
State agencies & PUCs
Track where DER investment delivers the most grid and community value.
How it works
From question to target list in three steps.
Ask
Describe what you're looking for in plain English. No filter panel, no query syntax to learn.
See
Matching buildings light up on the map. Click any one for its full profile — the feeder that serves it, grid capacity, heating fuel, size, year built, and who owns it.
Act
Export the matched set as CSV — addresses, owner names, and feeder details, ready for outreach, analysis, or your own models.
Access
Use the app, or bring your own agent.
The same building intelligence, two ways in — whichever fits how you work.
The CapacitiMap app
A chat interface beside an interactive map. Nothing to install — start asking straight away. Toggle layers, click any building for its full profile, export what you find.
Your own agent, via MCP
Connect Claude or any MCP-compatible tool to the same building intelligence and query it from your own workflows.
Find where your next project belongs.
Try the live demo, or book a walkthrough with our team.